##Overview
This application is designed for the integration of data and functionalities. Its design is based on the idea of the Entity: anything that can be unambiguously identified, and be subject of investigation. Examples of entities are: genes, proteins, SNPs, samples, pathways, etc.
Each entity has a report, which depends on the type of entity it is. All reports are computed on the fly and cached. In addition to the main reports, entities have actions, which are sub-reports that implement particular analysis. For instance, for gene entities one of the actions is to display a summary of the relevance of that gene across the collection of studies that you have access to. In addition to entities, there are reports for lists of entities and for entity maps, which are tables that relate entities to values, such as genes to their average mutation frequency.
##Important definitions
Its common to think of coding variants as synonymous or non-synonymous. We find that this distinction is slightly inappropriate; a variant might be synonymous and still have a consequence in the protein isoform, for instance variants affecting exon junctions and that might interfere with splicing. Isntead of this nomenclature we prefer to talk about relevant and not relevant variants. Our current definition of relevant are variants that can potentially alter the function of at least one of the isoforms of a gene; this currently includes non-synonymous variants and variants affecting splicing sites (-2 to 8 bases of the donor end and -8 to 3 bases of the acceptor end).
##User interface
The user interface offers a general structure for all reports that allows to enact workflows, explore the results and connect functionalities with one another. This web site is ‘responsive’, meaning that it adapts to the size of the device you are using: computer, tablet, or phone. On small devices many of the layout elements shift around or get hidden behind toggle buttons to accommodate themselves better to the screen size. The examples below are taken from a computer screen. The site layout and style are under revision so the images might not look different, but the functionalitity is the same.
- Report structure
-
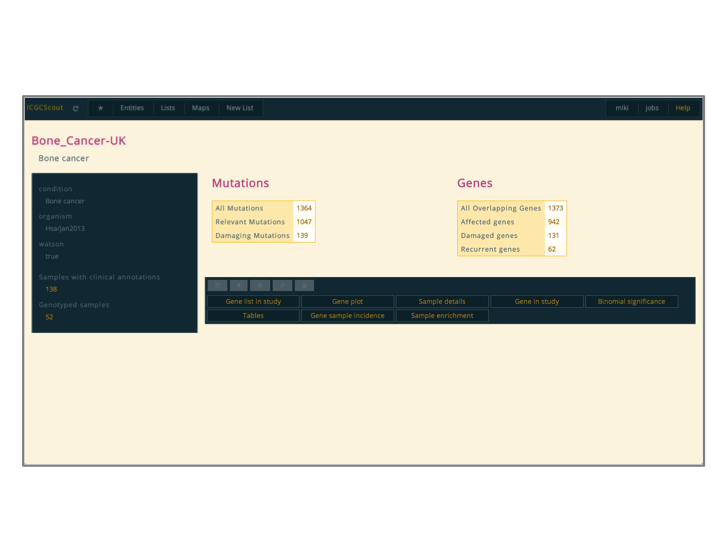
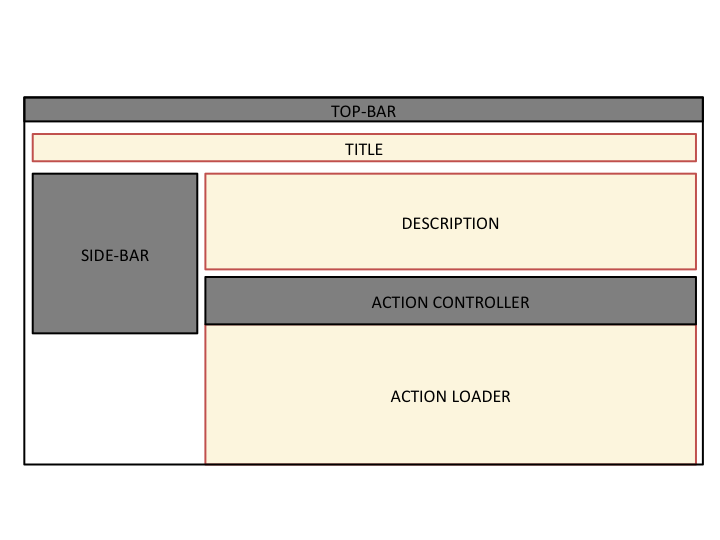
This application presents reports for individual entities, lists of entities, and entity maps. Each type of entity (gene, study, pathway, etc.) has its own report template, and they are prepared on-demand.
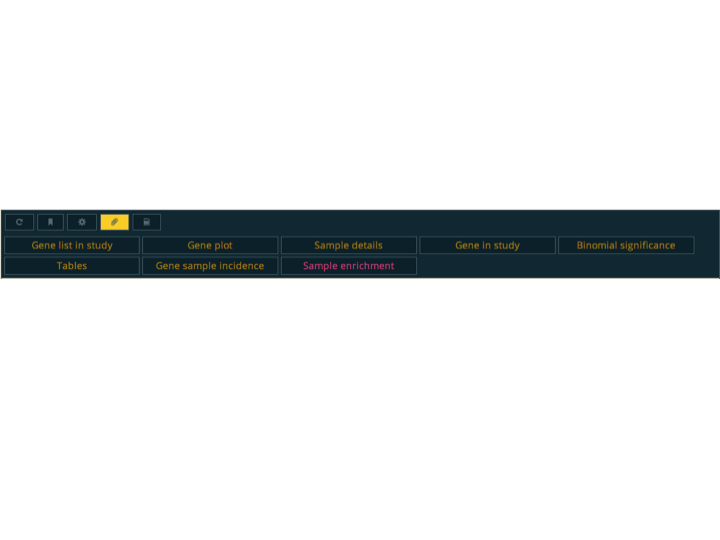
All reports have the same overall structure; the images show a report for a genotyping study from the ICGC project. The top-bar is always there and provides a placeholder for several functionalities, most importantly the control of
favourites.Bellow the top-bar comes the report itself. It consists of a title, a side-bar, a description, and an
action controller. In general the side-bar is used to show general meta-data about the entity and the description to show a brief overview.The action controller offers access to
actions, which are like sub-reports. Each type of entity has its own actions. If the entity type in particular does not have any action defined then the action controller will not be displayed. When an action is selected, it will be displayed below, in the area called action loader.Actions can also be opened in their own page, clicking the middle-button like any link. These pages are like reports but with no action controller or side-bar
- Snapshot
-
- Explanation
-
- Top-bar
-
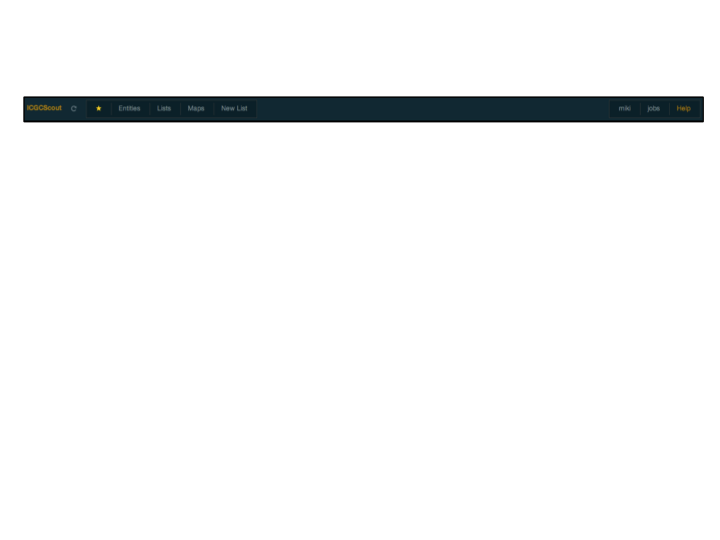
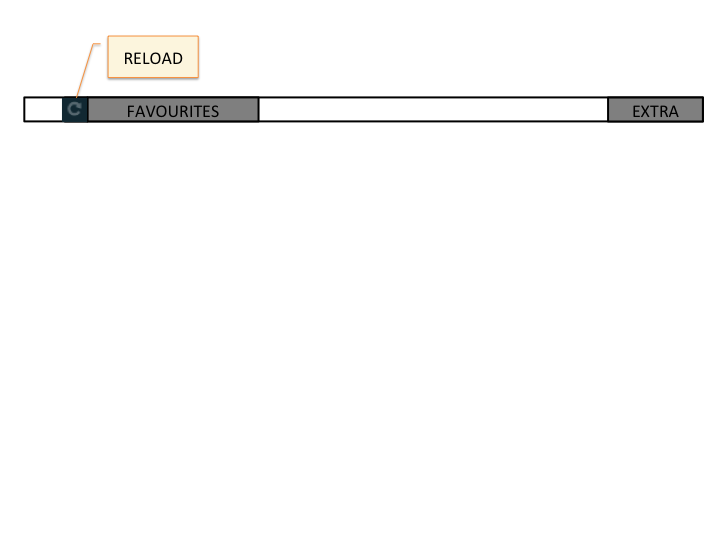
The top-bar provides access to several functionalities. Clicking on the title of the application will link to its front-page. Next to it is the reload-button, which is used to force the server to recalculate a report, otherwise the report will be taken from a cache. This is useful when a report has given an error or when when it was updated somehow. Note: After a reload of the report, the browser might still try to get the file from its own cache, so you might need to use the reload button in the browser as well; I’m planning to fix this.
Next is the
favouritescontrols, which we will discuss shortly. After that there might be a search box, if the server was started with that functionality. This search box can be configured to identify any type of entity, but generally it is only genes.The final component of the top-bar, which I label “User”, has the user controls, which allows to login or logout, and the job bookmarks, where bookmarked actions are kept. Also this help page. Will discuss bookmarking actions latter.
- Snapshot
-
- Explanation
-
- Favourites
-
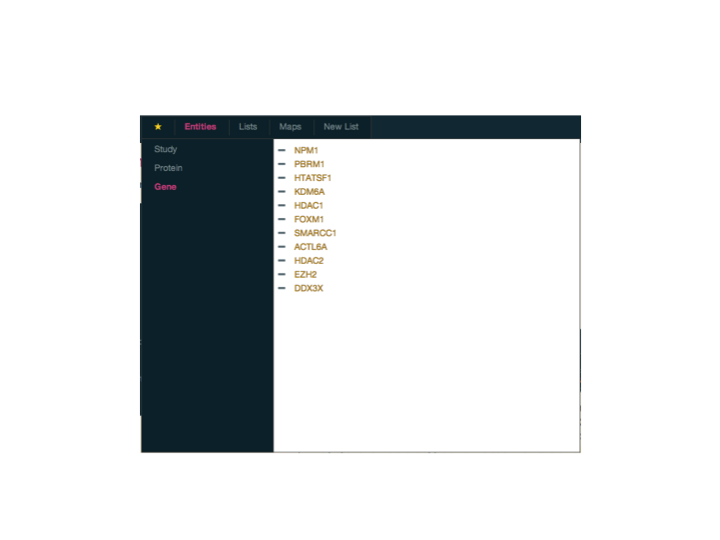
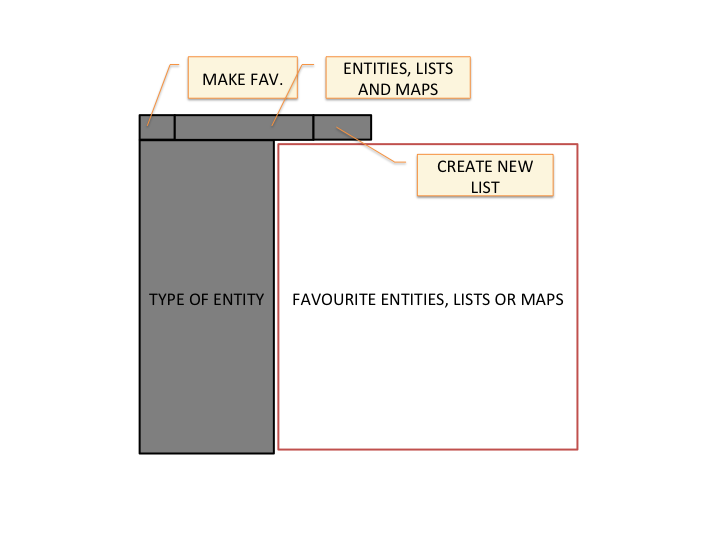
As we said before, we have reports for entities, lists, and maps. Clicking the star on the favourites control makes a favourite out of what-ever we are viewing: an entity, like a study; a list of entities, such as the genes mutated in the study; or a map, which could for instance map genes to the ratio of mutations per amino-acid in the COSMIC database.
Favourites are used not only to track our interests, but as a means to communicate between different functionalities or parts of the application. We could for instance make a list of genes a favourite and then go to a study report, open the “Gene list in study” action, select our list from all the favourites and see a report of how these genes are affected in the study
The favourite controls have an option to create a new list of entities from scratch. This allows a user, for instance, to make a list with her genes of interest instead of having to browse the application to find it. Note: New lists are not made favourite be default, you still need to click on the star once the report is shown.
- Snapshot
-
- Explanation
-
- Actions
-
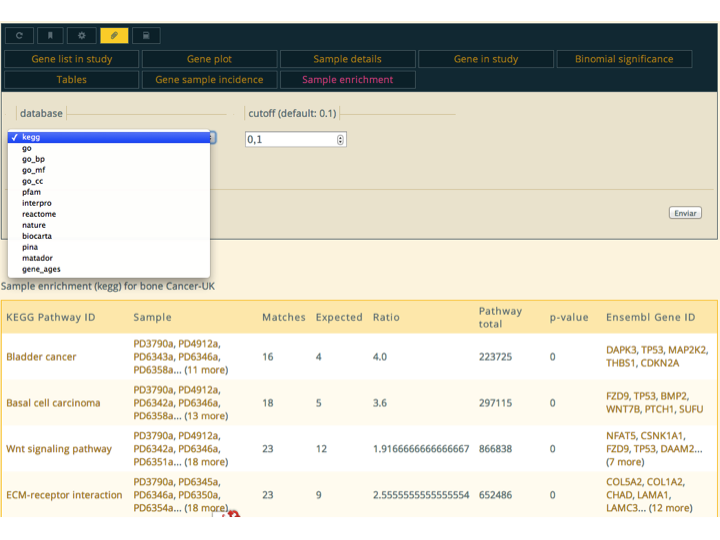
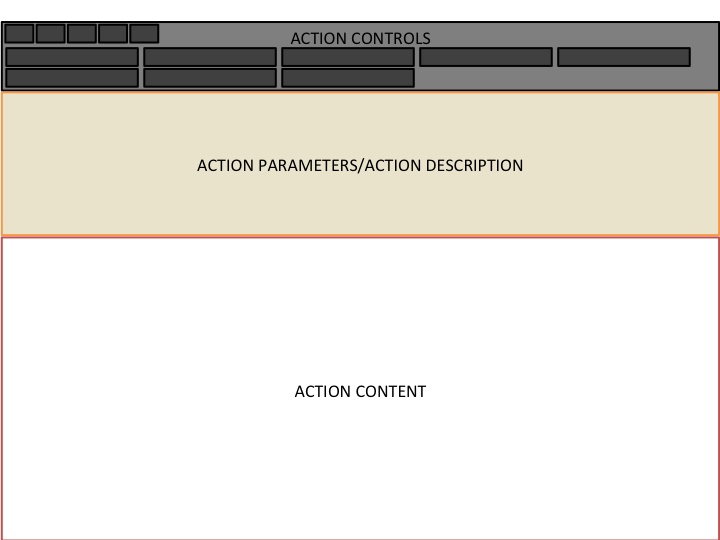
Actions are the primary way to integrate data and functionalities. Some actions are defined globally, but most commonly they are defined inside workflows; when a report is produced, all workflows are interrogated to see if they provide actions for it. The great majority of the actions are defined in the
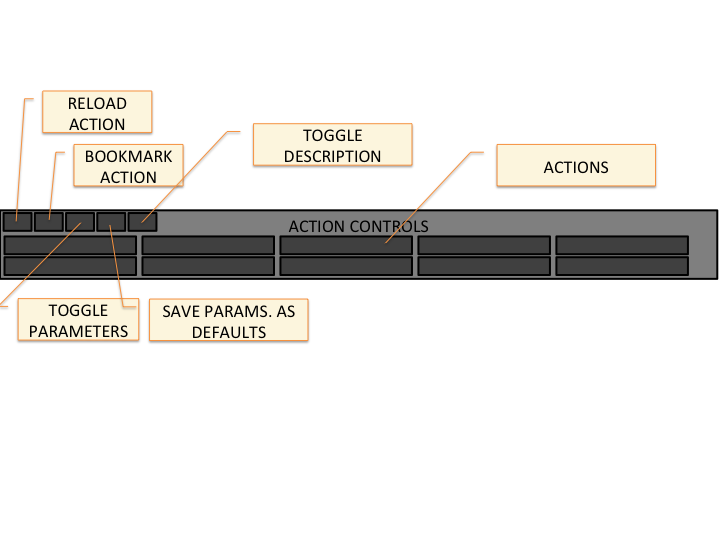
Genomicsworkflow.When an action is selected, it loads below the action controller. An action report consists of the content of the action, and optionally, documentation a report the parameter controls and description are hidden, but they can be shown using the action control buttons in the top left of the action controller. Actions can also be opened in their own report by right/middle clicking on its button.
As with all reports, they are executed the first time they are requested and the result is cached for further access. The action control buttons can be used to reload the action, just like the reload button in the top-bar does for the complete report. The actions will of-course be recomputed for each configuration of parameters. The parameters of the action can be favourites from the user, lists or maps. These are presented to the user using an input
select, and are synchronized with the user current favourites.If an action is used often with a particular combination of parameters. For instance the “Enrichment” action of gene lists performs an over-representation based analysis of functional classes. The functional classes include several pathway databases, protein domains, gene ages, etc. If we where interested primarily in performing enrichment analysis using GO biological process terms, we can use the paperclip button to set that configuration of parameters as default, so that it always uses it initially.
Some actions may require a significant amount of time to compute. The action controller tries to reload the action periodically until it is completed (after a while it will stop insisting to not overload the server). Instead of having to wait on that page for it to finish, the user can click on the bookmark button, which will place a link in the “jobs” tab on the “Extra” menu of the top-bar, and come back to it later.
- Action Snapshot
-
- Action Explanation
-
- Controller Snapshot
-
- Controller Explanation
-
- Tables
-
Tables in this application come enhanced with several functionalities. The rows can be sort by the values of any column.
The values of the columns can also be used to filter the rows of the table through the
filterbutton. The filters are defined per-column, and can contain exact strings, regular expressions like/(COMPLETE|PARTIAL) RESPONSE/i, statements such as> \< ==or!=. And columns containing entities they can be prefixed with the termname:to force the filtering to work over the human readible text of the entities e.g.name:/SF3B\d+/for a column containing ‘Ensembl Gene ID’.When a column contains entities, these are usualy listed in the table using some identifier like ‘Ensembl Gene ID’ for genes or ‘GO Term IDs’, etc. When displaying the table, it automatically substitutes these identifiers with links to their corresponding reports, and lists them by name. Additionally the
columnbutton allows the user to report the list of entities of any column or, if the first column is itselve an entity, it allows the user to report themapbetween the entities in this column and the values of any other column. Maps are generally used as inputs to actions and tools, but may have actions as well; gene maps have an action that performs a rank-based enrichment analysis (provided the Enrichment workflow is loaded in the server).The content of the table can be downloaded in two forms, as TSV files, which is the original source of the table, or as Excel files. When downloding as Excel files, since are generally intended to be read by people, all entities listed that can be translated to a more human readible identifier are translated automatically. This includes change genes identifiers from
Ensembl Gene IDtoAssociated Gene Name, or changing KEGG pathway ids to their descriptive name.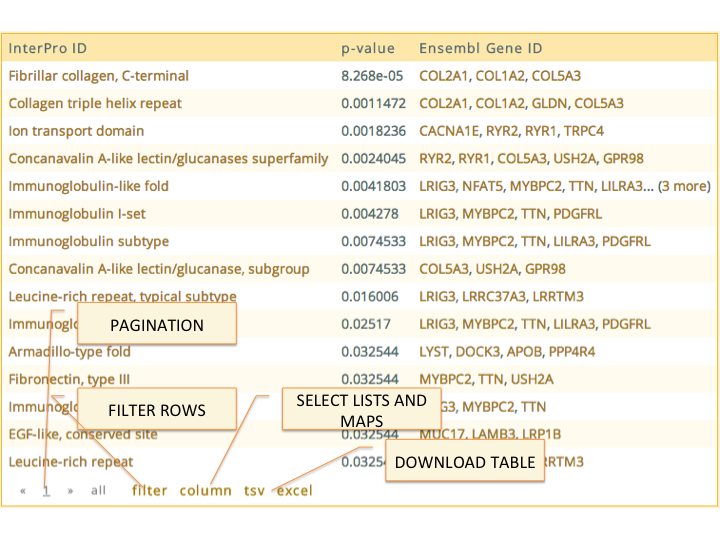
- Tools
-
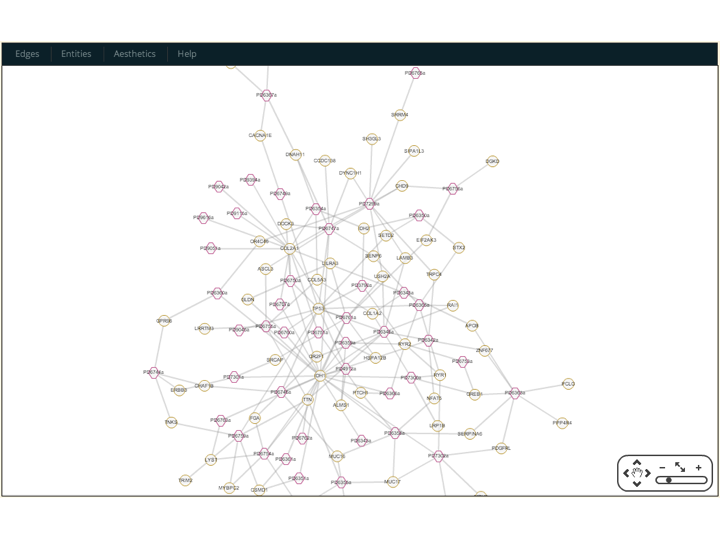
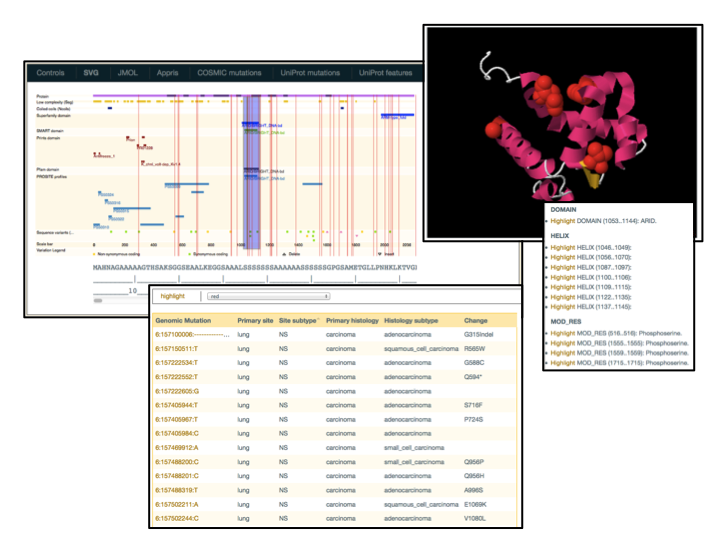
Some workflows implement
tools, which provide special interactive visualization for different types of data. For instance: theGraphworkflow implements thecytoscapetool, which is used to display different kinds of entities connected through databases or analitical results (defined asknowledge_bases, but that is a subject for another discussion); theStructurejmoltool displays mutations in the secondary and tertiary structures and complexes; and theD3Jsworkflow that implements a tool to displayd3jsinteractive SVG figures. Alternative R is used through a native interface in Rbbt to display plots usingggplot2.These tools are used by different reports and actions. The
Graphworkflow for instance redefines the template forGenelists to include a cytoscape plot to the description section of the report.- Cytoscape
-
- Jmol
-
- D3Js
-
##Workflows
In addition to exploring entity reports, this site servers collections of core functionalities through the Workflow subsystem. This is the same interface that is used as a REST web server, so it serves to document it.
| Workflow | Description |
|---|---|
| Proteomics | This workflow offers several functionalities to explore the consequence of protein mutations. It reports features that overlap the mutations, or that are in close physical proximity. |
